Charting Cumulative Variance in Multi-Hand Card Game Sequences
Zoe Schmid · Jun 22, 2026

Charting Cumulative Variance in Multi-Hand Card Game Sequences
Researchers have long examined how returns accumulate across repeated hands in games such as blackjack, baccarat and poker variants, and the resulting spread of possible bankroll outcomes forms the basis for risk distribution curves. These curves plot the probability of reaching various terminal wealth levels after a fixed number of decisions, incorporating the per-hand expectation and variance that each game produces under standard rules.
Core Components of the Curves
Data from large-scale simulations show that blackjack played with basic strategy carries a house edge near 0.5 percent while variance per hand sits around 1.15 squared units. When these parameters feed into sequential models, the distribution of final results begins as roughly normal for short sessions but develops skewness and kurtosis as hand counts rise into the hundreds. Observers note that early outcomes exert outsized influence on later position because each result updates the running bankroll that determines bet sizing in many practical scenarios.
Modeling Sequential Dependencies
Analysts construct these curves through Monte Carlo methods or recursive probability calculations that track every possible path. A single starting bankroll branches into thousands of simulated trajectories, each reflecting the independent trial nature of most card games while allowing for rule-specific adjustments such as doubling or splitting. The resulting histogram converts into a smooth curve that displays both the mode, representing the most probable outcome cluster, and the tails that capture ruin probabilities or large-win scenarios. Studies from the University of Nevada, Las Vegas indicate that even modest changes in per-hand variance shift the width of these curves dramatically once sequences exceed 200 hands.
Card composition effects introduce additional layers. In baccarat the fixed drawing rules create lower variance than blackjack, narrowing the distribution and reducing the frequency of extreme deviations. Poker variants add player-skill components that alter both mean return and variance depending on table dynamics and opponent modeling. Those who compile empirical records from regulated markets often find that real-world curves deviate slightly from theoretical ones because of factors such as deck penetration changes and player fatigue.
Practical Mapping Tools
Software packages used by gaming analysts convert input parameters into visual risk profiles. Users enter starting bankroll, average bet size, game-specific edge and variance, then receive plots showing the percentage of paths that fall below zero at each step count. These outputs help operators and researchers compare different table limits or rule sets without conducting live trials. Figures released by the Nevada Gaming Control Board in early 2026 illustrate how table minimum adjustments alter the slope of ruin curves for sequences lasting several hours.
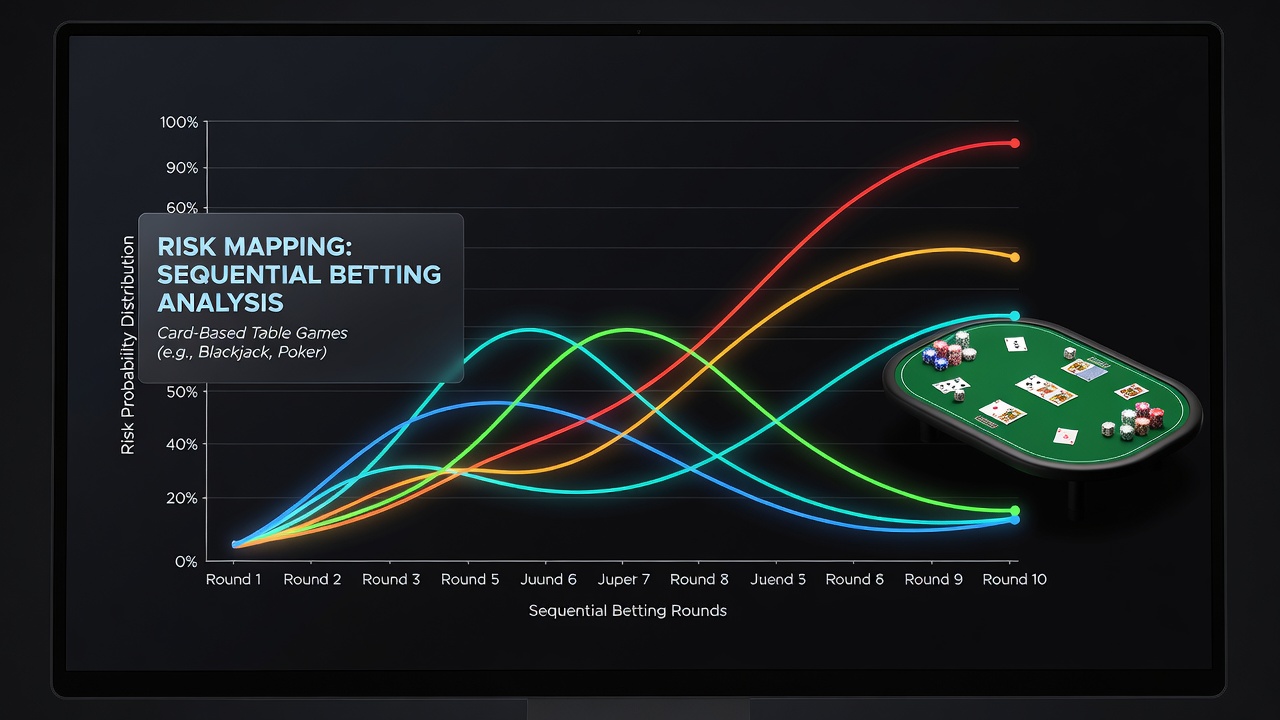
June 2026 saw several academic groups release updated simulation libraries that incorporate multi-deck reshuffle effects and side-bet interactions. The new modules allow finer granularity when mapping how a sequence of insurance decisions or progressive side wagers modifies the overall distribution shape. Analysts have observed that adding even low-frequency side bets can fatten the right tail while leaving the left tail largely unchanged, producing asymmetric risk profiles that standard normal approximations fail to capture.
Regional Data Comparisons
Comparative work draws on records maintained by different regulatory bodies. Australian state gaming reports provide detailed hand-volume statistics from licensed clubs, while Canadian provincial data sets offer insight into regional rule variations. When researchers align these data sets against theoretical curves, discrepancies typically trace back to differences in average bet size relative to bankroll rather than fundamental probability shifts. One study released through the Journal of Gambling Studies linked higher table minimums with steeper initial descent in the left tail of the distribution, a pattern consistent across multiple jurisdictions.
Interpretation Guidelines
Professionals interpret these curves by focusing on specific quantiles rather than single-point estimates. The 5 percent quantile, for instance, shows the bankroll level below which only one in twenty sequences will finish. Because sequential betting often involves adjustments based on prior results, the curves must be recalculated whenever bet-sizing rules change. Those adjustments do not alter the underlying hand probabilities but do reshape the path distribution by concentrating or spreading capital across rounds.
Conclusion
Mapping risk distribution curves supplies a quantitative framework for evaluating how sequences of card-game decisions translate into terminal wealth outcomes. The approach combines established per-hand statistics with computational techniques that generate full probability profiles, allowing precise comparison across rule sets, bankroll sizes and session lengths. Continued refinement of simulation tools and access to aggregated regional data sets support increasingly accurate representations that reflect both theoretical expectations and observed play patterns.