Tracking Exposure Levels in Blackjack Card Counting Amid Shifting Casino Protections
Bianca Braun · Jun 1, 2026
Tracking Exposure Levels in Blackjack Card Counting Amid Shifting Casino Protections
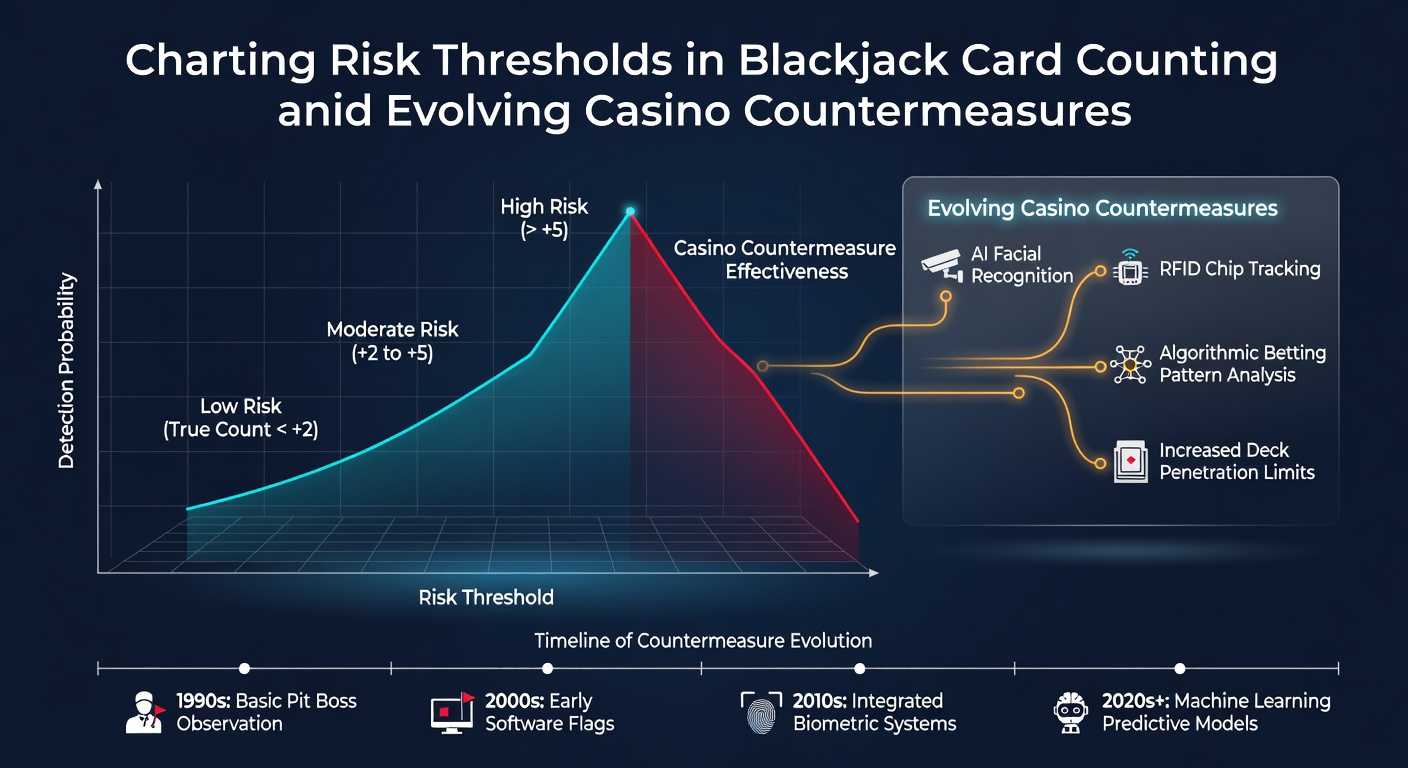
Card counting in blackjack relies on tracking the ratio of high to low cards remaining in the shoe, and professionals establish specific exposure points where bet sizing must stay within calculated boundaries to limit detection while preserving edge, according to mathematical models developed over decades of play. These thresholds shift constantly because casinos deploy layered defenses that include frequent reshuffles, multi-deck additions, and automated monitoring systems designed to flag irregular wagering patterns.
Core Elements of Risk Threshold Mapping
Observers note that true count conversion forms the baseline for any threshold system, since a running count alone fails to account for decks still in play, and players adjust wagers only when the true count crosses predefined triggers that balance expected value against the probability of increased scrutiny. Data from industry reports shows that many practitioners divide their action into zones labeled green, yellow, and red, where green allows standard table minimum bets without deviation, yellow permits modest increases, and red demands either immediate departure or camouflage through varied bet timing and session length.
Research indicates that variance calculations sit at the heart of these maps because even a strong count yields losing streaks that can exhaust bankrolls if bet ramps climb too steeply. Those who study bankroll survival emphasize that risk of ruin formulas incorporate both the player's edge at each true count level and the standard deviation of outcomes, which leads to conservative spreads such as 1-to-8 or 1-to-12 in six-deck games rather than the wider spreads that once worked in single-deck environments.
Evolving Casino Countermeasures and Their Impact
Casinos have moved beyond manual observation toward integrated technology that records every hand, bet amount, and player movement in real time, and this shift forces counters to recalibrate their thresholds more frequently than in previous eras. Automated systems compare current play against historical databases, flagging sessions where bet sizing correlates too closely with count-derived expectations, while facial recognition and loyalty card tracking add layers that connect multiple visits across properties.
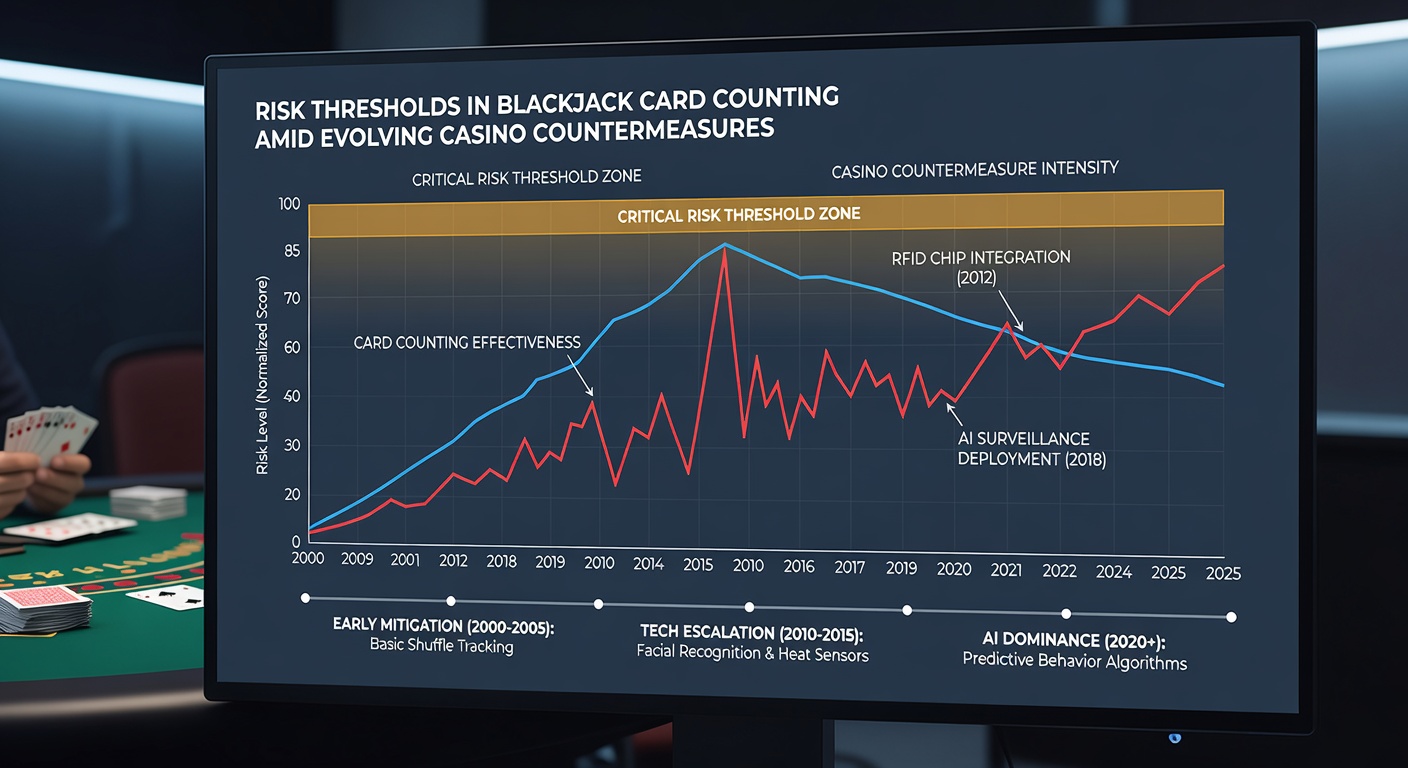
Figures released by the Nevada Gaming Control Board reveal steady growth in the deployment of RFID-embedded chips and table sensors that transmit data directly to central servers, allowing security teams to review hours of play in minutes rather than relying solely on pit bosses. In response, advantage players incorporate additional variables into their risk maps, such as table occupancy rates and dealer speed, because crowded tables and slower games reduce the number of hands observed per hour and thereby lower the chance that automated alerts trigger.
June 2026 Developments in Surveillance Integration
Updates documented in June 2026 show several major operators linking their internal systems with regional databases that share anonymized player metrics across jurisdictions, and this connectivity expands the window during which a single pattern of count-correlated bets can accumulate evidence of advantage play. Those monitoring regulatory filings note that these networks also incorporate machine learning models trained on thousands of known counting sessions, which improves the speed at which yellow-zone behavior escalates to red-zone intervention.
Players adapt by inserting deliberate errors into their count tracking or by rotating among multiple casinos within a single trip, tactics that dilute the signal reaching any one monitoring platform while still respecting the core thresholds that protect bankroll longevity. External studies from academic gambling research centers confirm that such rotation strategies reduce the cumulative detection probability when the underlying bet ramp remains modest and the session duration stays under predetermined limits.
Practical Application of Updated Threshold Models
Take one documented approach where a player maintains a 1-to-6 spread in six-deck shoes but inserts a mandatory cool-down period after any two consecutive yellow-zone bets, and this built-in pause disrupts the linear progression that surveillance algorithms often target. Another method layers table selection criteria on top of count thresholds, requiring a minimum number of players and a demonstrated average bet level from others at the table before any ramp begins.
Industry organizations such as the American Gaming Association have published summaries of how operators allocate resources to high-risk tables, and these reports indicate that properties prioritize tables showing rapid bet escalation over those with steady, moderate increases even when the raw edge appears similar. Consequently, refined risk maps now factor in expected scrutiny levels derived from historical heat data rather than treating all tables as equal.
Conclusion
Threshold charting in blackjack card counting continues to evolve alongside casino technology, and successful practitioners treat these maps as living documents that incorporate new surveillance capabilities, regulatory changes, and observed intervention patterns. Data from multiple jurisdictions demonstrates that modest adjustments to bet sizing combined with deliberate variation in session structure maintain positive expected value while reducing the rate at which automated systems escalate alerts, allowing continued play across evolving protective environments.